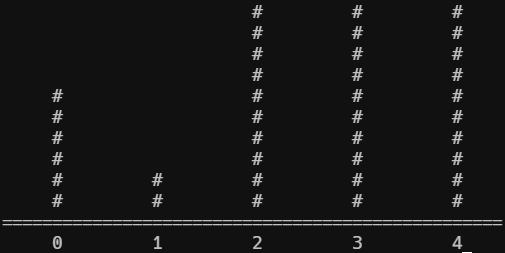
Terminal plotter
Project for showing ascii art-style graphs
Followers

cskartikey
Check their project out: The Journey
Ship Your Project

HOLD UP
By shipping your project, you're marking it as complete and it'll enter matchmaking. However, you will NOT be able to edit it anymore.
Timeline

I checked the performance and found an useless for loop making the rendering process like 5s long
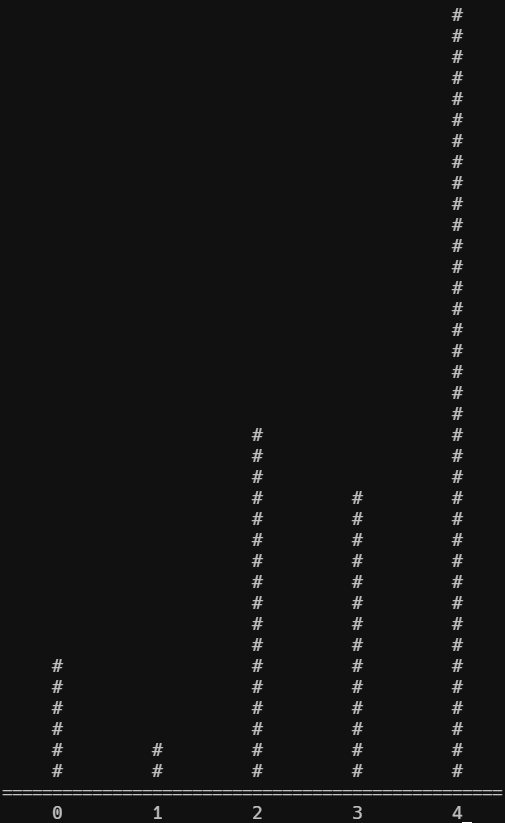
Added y labels for the graph plot, but I sometimes get an IndexError... Already hating my past self for messy code, this will be a pain to debug
I started out working on the rendering part. I plan on using braille characters since they give me 6 sub-characters per character, but if I want to do a line plot, I need some wonky math. I sketched it out and added some basic math utility functions I can use later.
I added graph offsetting, so I have a separator bar on the y axis. With longwriting, I think I can add y-axis labels next
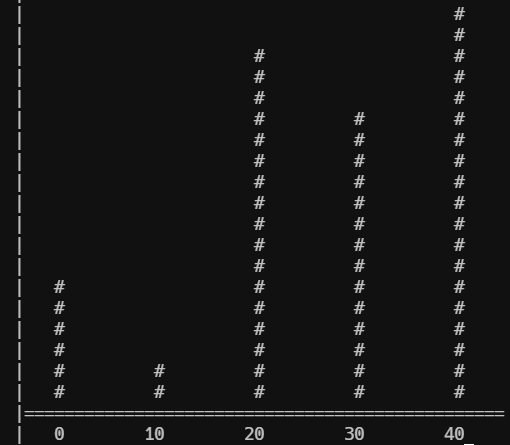
I added long writing (writing trailing characters into the rendering array correctly), which means custom labels can now be used for the X axis!
The deadline just jumped 12 hours closer, so I gotta lock in! I started writing support for multiple plotting datasets. I´m pleased to report that changing something that basically all code touches did not, in fact, break anything :D
I finally found the off-by-one bug which broke the graph and fixed it! I also added common graph things like labeled elements. I´m looking to add more labeling and perhaps using truecolor capability later.
I wrote the basic renderer, but it´s kind of buggy now - i´ll probably scour stackoverflow/check the code of some terminal utilities and see if it can be optimised
I implemented scaling (not sure how to call it) for the y-values, e.g. exponential and logarithmic. I also started laying out the basic rendering system, I´ll have to do more research about different terminals to ensure this will work for most users.
I started out working on the rendering part. I plan on using braille characters since they give me 6 sub-characters per character, but if I want to do a line plot, I need some wonky math. I sketched it out and added some basic math utility functions I can use later.
uh, what? i refreshed hackatime to get my time loaded, and instead this (my first update) got posted with that time, that´s weird… anyway, I added a reversing function so that I can generate labels on the y-axis.